Posts

Showing posts from October, 2018

Stop Watch The Game- Interactive Python 2

Image
This is another exercise in Python 2 using the simplegui library from Rice University. The description of the challenge is as follows: "Our mini-project for this week will focus on combining text drawing in the canvas with timers to build a simple digital stopwatch that keeps track of the time in tenths of a second. The stopwatch should contain "Start", "Stop" and "Reset" buttons....Finally, to turn your stopwatch into a test of reflexes, add to two numerical counters that keep track of the number of times that you have stopped the watch and how many times you manage to stop the watch on a whole second (1.0, 2.0, 3.0, etc.). " This is my version. I have two scree shots. Both games show the counter in milliseconds, the interactive Stop Watch and the score -which is in Red in the upper right corner of the canvas (stop watch).  The score shows "successful stops" / "attempts".

Bokeh Visualizations in Python

Image
Bokeh's website states that "Bokeh is an interactive visualization library that targets modern web browsers for presentation. Its goal is to provide elegant, concise construction of versatile graphics, and to extend this capability with high-performance interactivity over very large or streaming datasets. Bokeh can help anyone who would like to quickly and easily create interactive plots, dashboards, and data applications."   https://bokeh.pydata.org/en/latest/ I'm starting to use Bokeh for some exercises. The first results appear good.  I like that the data vizzes are  interactive.  The 3 plots below are related to female literacy and fertility.  The first plot is the default plot. The second and third plots show how a user can zoom in to see different parts of the data.

Guess My Number - Interactive Programming in Python 2

Image
This is a Guess My Number program in Python 2 using the simpleGUI module.  I am still beta testing it.  This is related to Coursera's Fundamentals of Computing Python specialization run by Rice University.  I already took the Scripting in Python specialization run by the famous professors and I liked it.  The BIG difference between the 2 specialization is that Fundamentals of Computing is done through peer -review while Scripting uses an online grading platform. Peer-review grading is not straight forward.  A lot of times people in the courses struggle to get their projects reviewed by peers. I am still waiting for the grade on my last assignment.  I might not get a grade if  not enough people ( 5) were able to review my program. This means I might have to either switch course sessions so that new people can review my work or I might have to go on the discussion forums-like most people do- and beg for people to review my program assignments. So why...

Interactive Programming in Python 2

Image
This is my first test of the simpleGUI library in Python.  It was designed by the Computer Science Professors at Rice University. They use it in their classes.  I am expecting to build a Pong game using simpleGUI and Codeskulpter in a few weeks.  Now what I have below is a simple counter that counts seconds. The user is allowed restart the counter using the "Click Me To Reset" button. From the exercise below, the most important learnings  were event-driven programming, event queue, handlers and program structure. I should note that this was built in Python 2 and not 3.  I generally use Python 3 but the Rice University videos were done using Python 2.

Maze Game in Python using Turtle

Image
This is my first attempt at a maze game in Python. The white squares are the walls and the blue circle is the first player. I will continue on with the game and post the final version.  After learning how to make basic games in Python using Turtle, I plan to move on to making simple games using Pygame.

Comments in C and SAS

Image
Where does SAS programming syntax come from?  As a SAS user I often take things for granted in SAS. Things are done because this or that is how SAS is?  One thing I always took for granted was comments in SAS.  However,  after learning that SAS was created from C, I started realizing that understanding C was important for improving in SAS. Comments in SAS come from C as well as SAS's semi-colon ";".  The first picture below is from C.  As a SAS programmer, you should instantly  see how C is very similar to SAS. The second picture is from SAS. It shows how comments are made in SAS. Understanding where SAS comes from, will help you understand why SAS is the way it is.

Tableau Vizzes

Image
These are my Tableau Vizzes on Tableau Public. My last viz was on the shooting percentages of the  Ball  (LiAngelo, LaMelo, and Lonzo) brothers.  The data showed that they were dead last in shooting percentage. I would like to do more vizzes but it takes a lot of time to get the data, clean the data, and then plan out the viz.  Right now, I am interested in doing more stuff with Python, R and  Java. Hopefully, in the future, I can do more vizzes.

Visualization and Python

Image
Today, I am posting some different visualizations that I made with Python. This is just a posting to show the different things that can be done with Python.

Images and Histogram Equalization in Python

Image
Many image processing algorithms use an image histogram. An image is basically a two-dimensional array of numerical intensities.  We can compute an image histogram by counting the occurences of distinct pixel intensities over all the pixels in the image. Histogram equalization is an image processing procedure that reassigns image pixel intensities. The basic idea is to  spread out the pixel intensities of the image using a CDF. In many cases, this will give the image  a sharper, contrast-enhanced image.  This is particularly useful in astronomy and medical imaging to help us see more features. In this example (DataCamp), I took an original image (see below) and then calculated its pixel intensity with histogram.  I then spread out the distribution of the pixel intensities and then used this to generate a new image (Equalized Image -see below)  using  the old image. Image grayscale image of Hawkes Bay, New Zealand(originally by Phillip ...

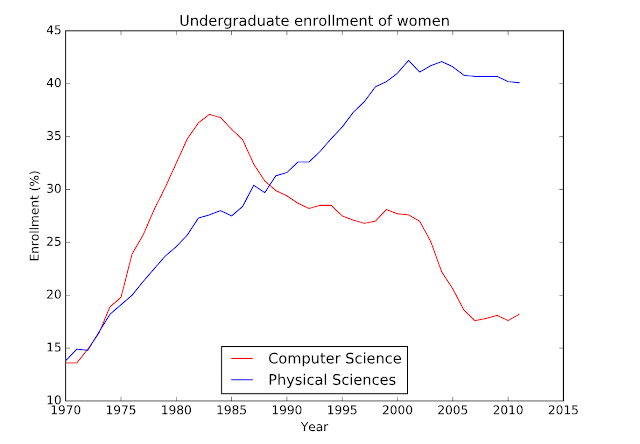
Undergraduate Enrollment of Women in Physical and Computer Sciences -Python

Image
DataCamp case study on US women's enrollment in physical and computer sciences.  The data set here comes from records of undergraduate degrees awarded to women in a variety of fields from 1970 to 2011. P hysical_sciences (representing the percentage of Physical Sciences degrees awarded to women each in corresponding year), and computer_science (representing the percentage of Computer Science degrees awarded to women in each corresponding year). There is also data on women's enrollment in health and education over the same period. The data is visualized in different ways using python.

Pong Final Version- Python 3

Image
I was able to finish my version of the Pong game this past weekend. I added scoring and sound.  I was able to add sound to the game using this window's winsound method. The sound isn't great but I am happy to do done with this version of the game. Adding sound games built with python turtle in windows: import winsound winsound.PlaySound("sound_file.wav", winsound.SND_ASYNC)