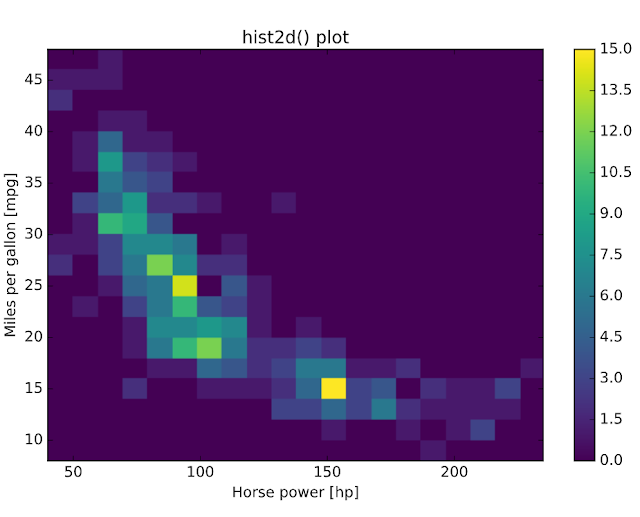
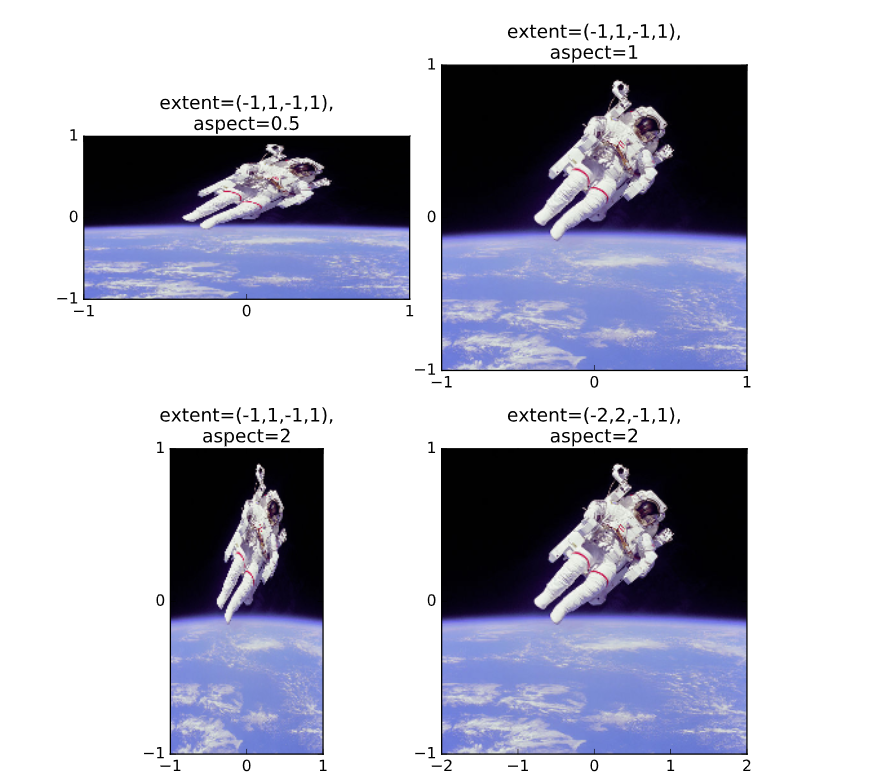
Today, I am posting some different visualizations that I made with Python. This is just a posting to show the different things that can be done with Python.
This is my first attempt at a maze game in Python. The white squares are the walls and the blue circle is the first player. I will continue on with the game and post the final version. After learning how to make basic games in Python using Turtle, I plan to move on to making simple games using Pygame.
This is the final version of the memory game. I submitted it for grading last week and did well. The problem with the online class is that I try to finish 90% of the projects before I submit them for grading. This causes me to take more time to do the class. I am constantly having to switch sessions. It also means that when I do finally decide to submit the project I have to go back over all the code. The moral of the story is always write detailed comments in your code.
Today, I have been working on replicating a Piet Mondrian painting using P5.js. This is for a class on Computer Programming. Since Mondrian is one of my favorite painters, I have decided to try to replicate more of his artwork. Here is the first painting below:


Comments
Post a Comment