JavaScript Connect4 Project Contnued
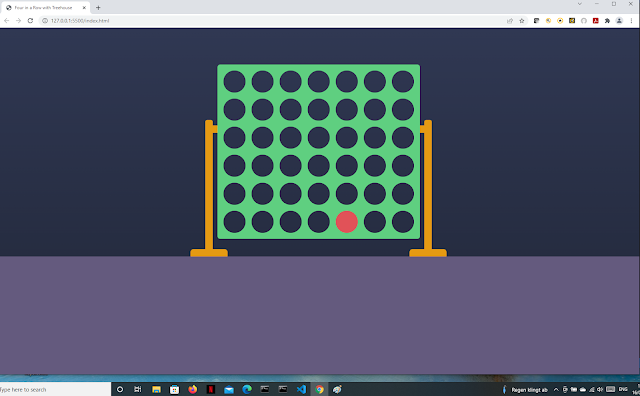
I'm continuing to make progress on the Connect4 game developed using JavaScript. At this stage of the game, I have added interactivity so that the user is able to move the token and drop it into position. The game is taking a while for me to complete, but I have been working on several other projects at the same time. I hope to complete the game by the end of February if possible. Here are some screenshots. I will present them in reverse order... In this screenshot, the token has been lowered into position. This screenshot shows the user's ability to move the token before dropping it into position. The last two screenshots show the start of the game. These screenshots are similar to an earlier post which is why I am showing them last.