R programming: Creating Graphs and Charts
While I generally prefer to work in Python and SAS, I must admit that it is pretty easy to create graphs and charts in R. I have been told by some statistics and economics professors that they prefer to teach their students R because it is easier for them to do data visualization.
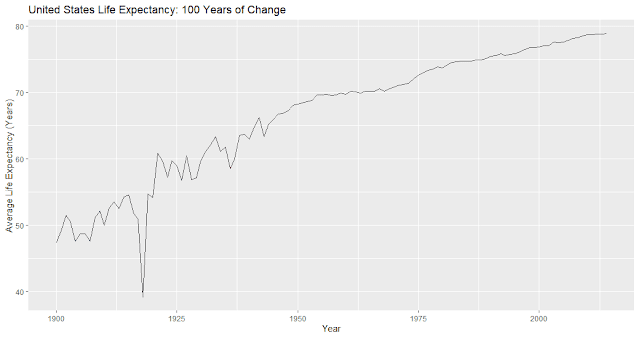
Below is a graph I created in R using data on life expectancy in the USA. Although it is a simple graph, the same graph would have required a lot more code in Python.
On a more personal note, I am back in R after spending the last few years learning more about Python and computer science.


Comments
Post a Comment